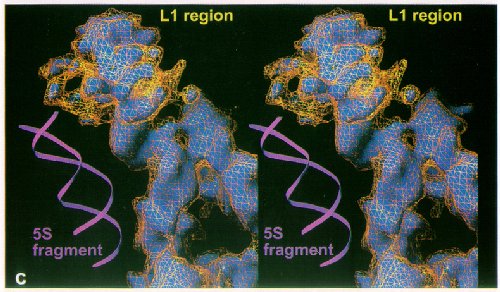
Fig. 6 A stereo view close-up of a 9 A resolution density map showing the region that includes ribosomal protein L1; a backbone ribbon model of part of the 5S RNA is shown adjacent for scale. The upper part of the density contains ribosomal protein L1, and the rest may represent rRNA that interacts with L1. The yellow cage is at a lower contour level than the solid blue.