Cryomicroscopy of Bacillus stearothermophilus 50S Ribosomal Subunits Crystallized on Phospholipid Monolayers
Avila-Sakar A. J., Guan T. -L., Arad T., Schmid M. F., Loke T. W., Yonath A., Piefke J., Franceschi F. & Chiu W.
J. Mol. Biol. (1994) 239, 689-697
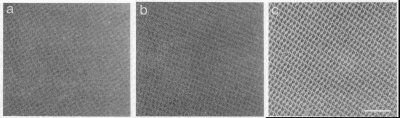
Figure 1. 100 KV electron images of ice-embedded crystalline arrays of 50S ribosomal subunits, taken at different defocus value from three different arrays. Ribosomal subunits are dark. Scale bar represents 1000 Å.
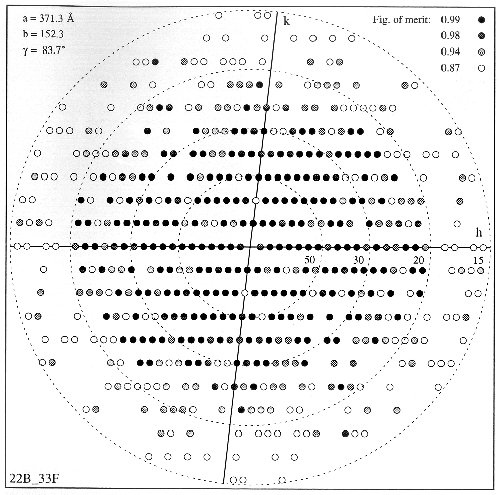
Figure 2. diagramatic representation of the merger structure factors from 10 image arrays with a total of 2070 cells, in terms od mean figure of merit. 90% of the expected reflections up to 20 Å resolution have a mean figure of merit >= 0.87. Between 20 and 15 Å, only 44% of the data have such a mean figure of merit. Such a reduction could arise from imaging conditions or from weak structure factors. p2 symmetry phase residual for structure factors up to 20 Å resolution is 24°.
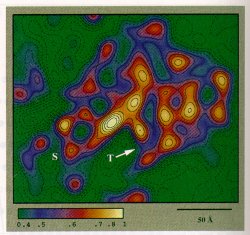
Figure 3. A color display of a single 50S ribosomal subunit highlighting the dense regions. Some of those dense regions may have high content of rRNA. Yellow color indicates high density and green color indicates low density. The protruding (labeled S) may include the stalk, identified by comparison to a low-resolution reconstruction. The arrow points to an internal low density region, which may be the entrance of the tunnel (T) which is thought to be the path of the nascent polypeptides.
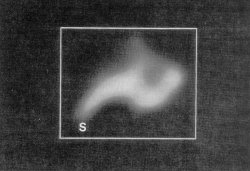
Figure 4. 2-dimensional projection map of one 50S ribosomal subunit at a resolution of 30 Å. The protrusion (S) can be nore readily recognizable from the map.