A tabulation of this data is provided here.
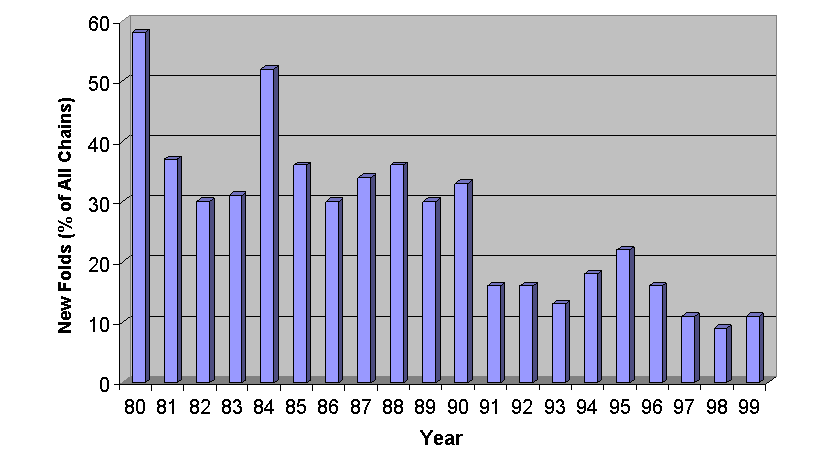
Note: A chain fold was considered old if it was similar to one of selected chains representing new folds according to the following criteria: z-score >= 4.0, RMSD < 3.0Å, number of aligned positions >= 70% of the length of this chain. Otherwise the chain fold was considered new.
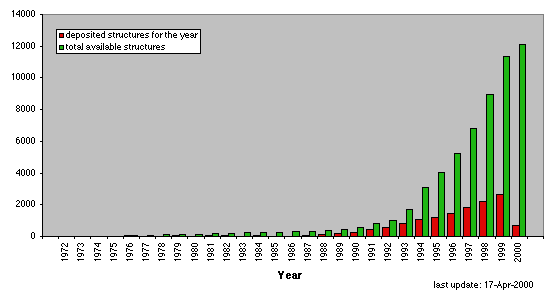
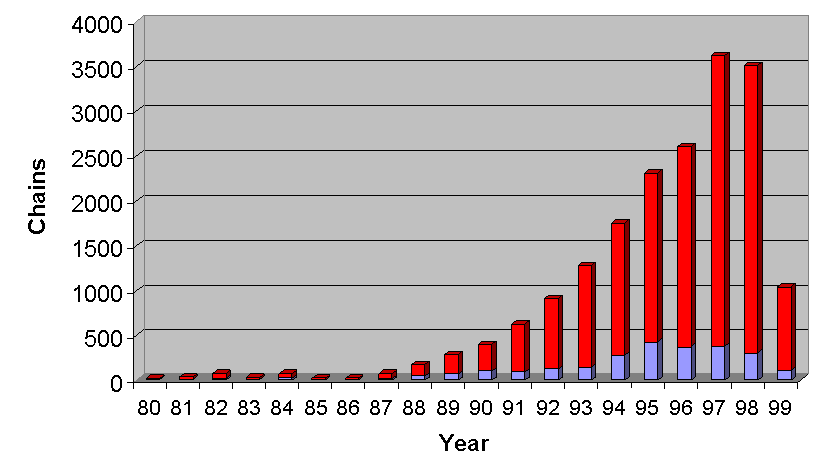
These graphs are based on PDB contents up to 16-July-1999.
| Molecule Type | ||||||
|---|---|---|---|---|---|---|
| Proteins, Peptides, and Viruses | Protein/Nucleic Acid Complexes | Nucleic Acids | Carbohydrates | total | ||
| Exp.
Tech. |
X-ray Diffraction and other | 9283 | 467 | 514 | 14 | 10278 |
| NMR | 1603 | 65 | 319 | 4 | 1991 | |
| Theoretical Modeling | 243 | 18 | 17 | 0 | 278 | |
| total | 11129 | 550 | 850 | 18 | 12547 | |