Vol. 3, No. 9, 15 September 1995
Weighing the evidence for structure: electrospray ionization mass spectrometry of proteins
[Ways & means]
Carol V Robinson, Sheena E Radford
Structure 1995, 3:861-865.

Outline
Structure
Vol.
3, No. 9, 15 September 1995
Weighing
the evidence for structure: electrospray ionization mass spectrometry of
proteins
[Ways & means]
Carol V Robinson,
Sheena E Radford
Structure 1995, 3:861-865.
![]()
Outline
Mass spectrometry (MS) has long been a tool of the analytical chemist.
The advent of electrospray ionization (ESI)
[1],
together with the simultaneous development of matrix-assisted laser desorption
ionization (MALDI) techniques [2],
has now opened up this powerful technique to use by structural biologists.
ESI MS and MALDI MS share common attributes such as their inherent sensitivity,
ability to study mixtures and accuracy in determining the molecular weight
of intact proteins [3] [4] [5].
The physical processes involved in obtaining mass spectra by these two
methods are, however, very different; MALDI MS relies on a light-absorbing
matrix and a laser pulse, to produce protein ions in the gas phase, and
ESI MS produces multiply charged gas phase protein ions from solution.
The ability of ESI MS to analyze intact protein samples directly from solution
therefore provides new opportunities for studies of protein structure and
function. In this article we draw attention to a group of applications
in which ESI MS, combined with hydrogen-exchange labelling, is used to
reveal information about the structure, folding and dynamics of proteins
in solution.
![]()
Putting
proteins in the gas phase
The essential features of the electrospray process are summarized in Figure
1. The protein-containing solution is introduced into the electrospray
ion source through a glass or stainless steel capillary, held at a high
voltage. The resulting spray of charged droplets is then evaporated with
nitrogen. When the droplets diminish to a critical size, protein ions are
released into the gas phase. The gaseous protein ions then enter the vacuum
of the mass spectrometer and are separated and detected according to their
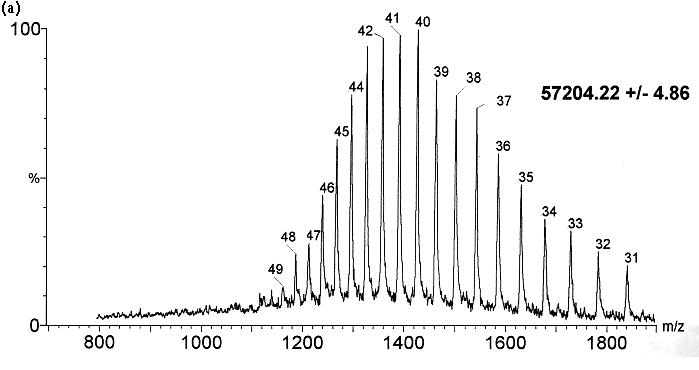
mass to charge ratio. The series of peaks in an ESI mass spectrum, therefore,
represents the distribution of multiply charged ions, known as the charge-state
distribution (Fig. 2). The distribution
of charge states observed is thought to reflect the spread of charges on
amino acid side chains principally the basic amino acids arginine, histidine
and lysine) that were protonated in the protein in solution [6].
Hence, the distribution is very sensitive to pH. Some attempts have been
made to correlate the charge-state distribution arising from a protein
with the PKa values of its ionizable amino acid side
chains as measured in solution. The relationship is not straightforward,
however, because other factors (e.g. counter-ions and the voltage settings
in the electrospray interface) affect the charge-state distribution observed [7].
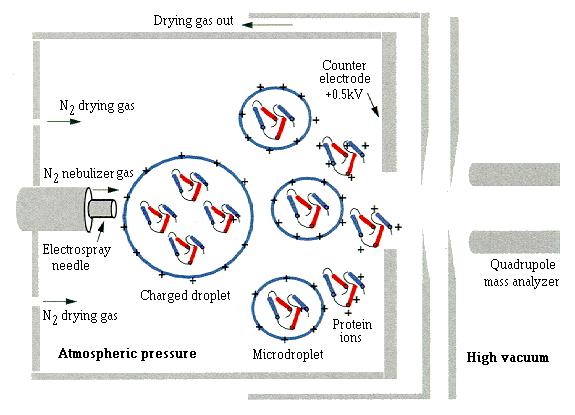 |
| Fig. 1. Schematic representation of the electrospray process (not drawn to scale). The protein solution is introduced into the mass spectrometer through a stainless steel electrospray needle, typically at 3 kV, using a nebulizer-assisted spray. Following evaporation of the solvent, highly charged microdroplets are formed which, upon further drying, release protein ions in the gas phase. Although the gaseous protein ions are depicted here in the same conformation as in the initial spray, the actual conformation of the protein in the gas phase is still a matter of debate [18]. The gaseous ions are then drawn through the electrospray source to the low pressure region, where they enter the mass analyzer. In a hydrogen-exchange labelling experiment, protein molecules containing different numbers of hydrogens (represented by blue shading) and deuterons (shown in red) are introduced into the mass spectrometer where, as long as the conditions are carefully chosen, no further hydrogen exchange takes place. |
 |
 |
| Fig. 2. Electrospray mass spectra of GroEL demonstrating the sensitivity of the charge-state distribution to the protein conformation. (a) Spectrum following introduction of GroEL from the native state into the mass spectrometer. (b) Introduction of GroEL after denaturation in acidic acetonitrile. Both spectra were obtained under identical tuning conditions in the electrospray interface. The charge states populated in (a) range from +31 to +49 and in (b) from +41 to +78. (Figure adapted from [9], with permission.). |
The resilience of a protein to exchange of its hydrogen atoms with,
for example, solvent deuterons is an exquisitely sensitive probe for determining
the structure and dynamics of proteins in solution [12].
This method exploits the fact that exchangeable hydrogens (the backbone
NHs and some amino acid side chains) in structured regions of a protein
exchange more slowly with solvent deuterons than those in unstructured
regions. As the atomic masses of hydrogen and deuterium differ by 1 Da,
the number of deuterated sites within a protein can be calculated from
the difference in mass between the hydrogen- and deuterium-containing forms of the protein. Furthermore, the kinetics
of the hydrogen exchange reaction may be measured in 'real time' as protein
masses can be measured within one minute of introduction of the sample
into the mass spectrometer. If a protein which has been deuterated at all
its exchangeable sites is dissolved in H2O, exchange will occur,
resulting in a decrease in protein mass as a function of time. Such real-time
hydrogen-exchange experiments, traditionally measured by 1H
NMR [12] and more recently
by ESI MS [13] [14],
have played an important role in our understanding of the conformation
and dynamics of both native proteins and labile, partially folded, states.
A dramatic illustration of this approach, in which real-time measurements
of hydrogen exchange were used to probe the conformation of a substrate
protein (
and deuterium-containing forms of the protein. Furthermore, the kinetics
of the hydrogen exchange reaction may be measured in 'real time' as protein
masses can be measured within one minute of introduction of the sample
into the mass spectrometer. If a protein which has been deuterated at all
its exchangeable sites is dissolved in H2O, exchange will occur,
resulting in a decrease in protein mass as a function of time. Such real-time
hydrogen-exchange experiments, traditionally measured by 1H
NMR [12] and more recently
by ESI MS [13] [14],
have played an important role in our understanding of the conformation
and dynamics of both native proteins and labile, partially folded, states.
A dramatic illustration of this approach, in which real-time measurements
of hydrogen exchange were used to probe the conformation of a substrate
protein ( -lactalbumin) bound
within the GroEL central cavity [9],
is outlined in Figure 3.
Despite the enormous molecular weight of the complex (>800 000 Da), good
quality mass spectra could be obtained from its native state in solution.
As the non-covalent complex dissociates in the mass spectrometer (where
no further hydrogen exchange takes place), charge states arising from both -lactalbumin
and the GroEL monomers are observed in the spectrum, allowing the number
of deuterons protected in -lactalbumin
to be accurately measured.
-lactalbumin) bound
within the GroEL central cavity [9],
is outlined in Figure 3.
Despite the enormous molecular weight of the complex (>800 000 Da), good
quality mass spectra could be obtained from its native state in solution.
As the non-covalent complex dissociates in the mass spectrometer (where
no further hydrogen exchange takes place), charge states arising from both -lactalbumin
and the GroEL monomers are observed in the spectrum, allowing the number
of deuterons protected in -lactalbumin
to be accurately measured.
 |
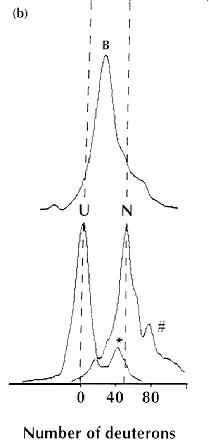 |
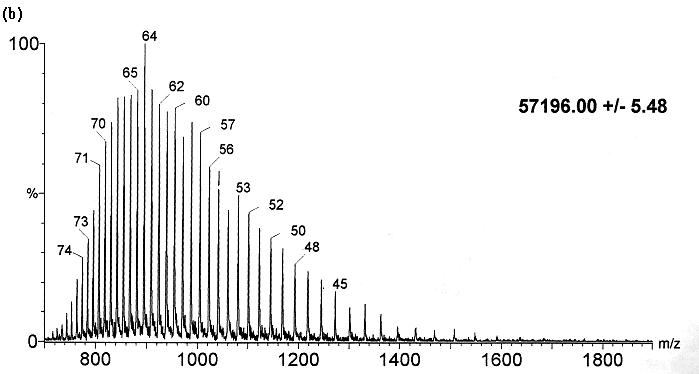
| Fig. 3. Schematic representation of the experiment
designed to measure real-time hydrogen exchange in a complex formed between
GroEL and -lactalbumin.
(a) A stable complex was formed by mixing the two proteins in D2O
solution, under appropriate conditions [19].
Hydrogen exchange in -lactalbumin
was then initiated by diluting the complex into H2O solution
and the mass of the -lactalbumin
was measured directly by ESI MS. The peaks in the mass spectrum labelled
(A) arise from -lactalbumin,
the remaining peaks can be attributed to the GroEL monomers. The blue and
red circles represent hydrogen and deuterium, respectively. (b)
A single charge state from the ESI mass spectra of different states of -lactalbumin,
20 min after dilution into H2O: (U) represents an unfolded state;
(N) the native calcium-bound state and (B) GroEL-bound -lactalbumin.
The small peaks labelled # and *, arise from -lactalbumin
derivatives that were present in the original samples. (Figure adapted
from [9], with permission.). |
-lactalbumin
in its native, partially folded (molten globule) and denatured states,
with those observed when it is bound to GroEL, revealed that the bound
protein is much more weakly protected than the native protein, but more
strongly protected than the denatured state. This suggests that the bound
protein closely resembles the well characterized, weakly protected, molten
globule state of this archetypal protein. The power of this approach, therefore,
lies in its ability to measure directly, and quantitatively, small numbers
of marginally protected deuterons, even in very complex systems.
Although ESI MS could, in principle, be used to study protein folding
in real time, starting with the denatured protein and ending with the native
state, in practice this is not generally possible, as many proteins fold
into their native states in a matter of a few seconds. To overcome this
problem, a pulsed hydrogen exchange procedure, identical to that used previously
in 1H NMR studies of protein folding [15],
was adapted for use in ESI MS [16].
In the first example of such an experiment (shown in Fig.
4), hen lysozyme, initially denatured and deuterated at all exchangeable
sites, was labelled with hydrogens at different refolding times and the
number of deuterons remaining was measured by ESI MS [16].
At the refolding time shown in Figure
4 (200 ms), each charge state contains three peaks, indicating the
presence of three different populations of molecules at the time of the
labelling pulse. One of these populations (shown schematically in blue)
corresponds closely in mass to that of hen lysozyme with no remaining deuterons,
showing that this population of molecules was not stably folded at the
time of the labelling pulse. In the heaviest population (shown in red),
55 deuterons persist after the labelling pulse. This peak corresponds to
molecules which had folded to a native-like state within 200 ms. The largest
peak has a mass between those of the unprotected and native-like states,
showing that a distinct, partially folded, intermediate was present in
the refolding solution at the time of the labelling pulse. This peak corresponds,
in its mass and kinetics of evolution, with the formation of persistent
structure in the domain
of hen lysozyme, this domain having been previously identified as a distinct
folding domain by pulsed hydrogen exchange, measured by 1H NMR [15] [17].
This highlights the power of the combination of MS and NMR, the former
requiring relatively minute amounts of protein and providing information
about populations of folding molecules, whilst the latter, although averaging
the properties of the populations, provides the site-specific information
needed to make the leap between the number of deuterons and structural
information.
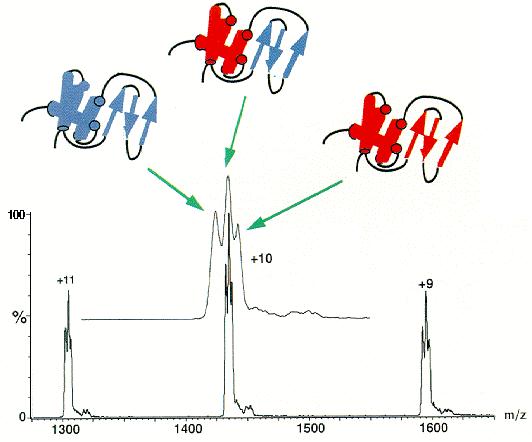 |
| Fig. 4. A single time point (200 ms) in the pulsed hydrogen-exchange labelling experiment designed to measure the lysozyme folding pathway by ESI MS. The electrospray mass spectrum shown contains the +9, +10, and +11 charge states of hen lysozyme, each of which consists of three distinct peaks (shown more clearly in the expanded +10 charge state). Each peak in a single charge state represents a distinct population of molecules that were folded to different extents at the time of the labelling pulse. |
In addition to the charge-state distribution and average mass of proteins,
further information about the nature and the distribution of protected
molecules in a hydrogen-exchange experiment can be obtained from the width
of the signals for individual charge states in the mass spectrum. Although
the charge states have a natural linewidth, which arises predominantly
from the resolution of the instrument and the natural heavy isotope abundance,
the range of deuterated states present in a hydrogen-exchange experiment
results in additional broadening of these peaks. The peak arising from
the +12 charge state in the mass spectrum of -lactalbumin
when bound to GroEL, for example, is much narrower than would be expected
if a large number of -lactalbumin
species were present, (i.e. ranging from native-like molecules to molecules
in the unprotected denatured state), revealing the specificity of GroEL
for weakly protected states. Similarly, the presence of well resolved peaks
in the lysozyme pulse-labelling experiment indicates that the
domain intermediate forms a distinct and well defined population. Thus,
comparison of peak widths may be used to gain valuable insight into populations
of molecules involved in hydrogen-exchange reactions.
![]()
Future
prospects
The ability to monitor hydrogen exchange in native and partially folded
states by ESI MS has added a new dimension to studies on protein folding.
Not only does the advent of ESI MS extend the range of proteins amenable
to these studies well beyond those suitable for detailed NMR analysis,
but it also provides an opportunity to analyze individual components in
complex mixtures. This capability, and the plethora of non-covalent complexes
of biological importance, suggest that mass spectrometry will play an increasingly
important role in protein characterization, well beyond its initial role
of validating molecular masses. The studies outlined in this article, therefore,
represent only a drop in the ocean of the new and exciting applications
that are sure to lie ahead.
![]()
Acknowledgements
We acknowledge support from the BBSRC, EPSRC and MRC through the Oxford
Centre for Molecular Sciences. SER is a Royal Society 1983 University Research
Fellow. We thank Robin Aplin for introducing us to ESI MS and Brian Green
(VG Biotech) for helpful discussions. We acknowledge, with thanks, Andrew
Miranker and Michael Gro? for their invaluable contributions to the work
described in this article and for reading this manuscript before publication.
Finally, we thank Christopher Dobson for inspiring much of this work and
for his continued interest and support throughout this project.
![]()
References
-lactalbumin
probed by mass spectrometry.
-helices
and  -sheets as monitored
by electrospray ionization mass spectrometry.
-lactalbumin.
-sheets as monitored
by electrospray ionization mass spectrometry.
-lactalbumin.