2.3.4 Examining the Dendrograms
1. At the start of the hierarchical clustering algorithm, each row is considered a cluster unto itself. Let's call these singleton clusters B, F, H, L, P, and Z to distinguish them from the corresponding points Bob, Flo, Herb, Liz, Pat, and Zeke. At each step thereafter, those clusters which are closest together1 will be merged.
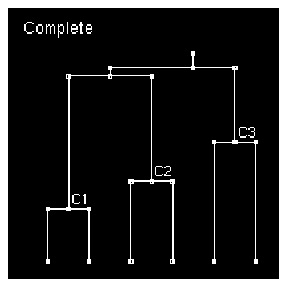
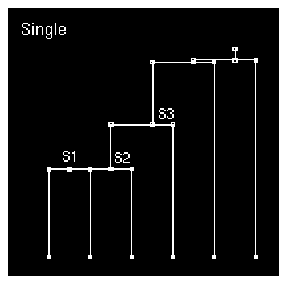
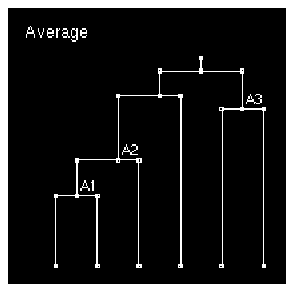
The left-most point in a dendrogram always corresponds to the first row included in the analysis. For all methods, the distance between singleton clusters is simply the distance between the constituent points. Because Bob and Flo are closest together, they form the same first cluster under all three linkage methods. Let's call this cluster C1, A1, and S1 in the Complete, Average, and Single dendrograms, respectively. Flo is assigned to the second position from the left in each dendrogram.
 Select rows Bob and Flo in cluster_types.
 Press Show RowSel.
The corresponding points are highlighted in the graphs.
 Press Cancel in the Locate prompting dialog.
2. The methods diverge in the next step, because they have different definitions of how far clusters are from each other. Consider Herb, which is at the bottom center of the Methods graph.
 Select the third row, Herb, then press Show RowSel.
Flo is the closest point to Herb, followed by Liz, but Flo has been absorbed into cluster C1 (or A1 or S1) in the first step, and it is the distance from the singleton cluster H to other clusters which matters here.
- Under Complete linkage, the distance from cluster H to cluster C1 is the maximum pairwise distance from Herb to any point in cluster C1, i.e., the distance to Bob. This is greater than the distance to Liz, so the second Complete clustering step entails creating cluster C2 from Herb and Liz. Herb is the third clustering point, Liz is the fourth.
Figure 8 Complete Clustering

- Under Single linkage, the distance from cluster H to cluster S1 is defined as the minimum pairwise distance from Herb to any point in S1, i.e., the distance to Flo. This is smaller than the distance to Liz, so the second clustering step is to add Herb to S1; call the result S2.
Figure 9 Single Clustering

- With Average linkage, the distance from Herb to Cluster A1 is defined as the average pairwise distance from Herb to each point in A1. This happens to be slightly less than the distance to Liz, so Average linkage also add Herb to create A2 in the second clustering step.
Figure 10 Average Clustering

3. The second clustering step for Complete linkage assigned Liz as the fourth point from the left. What is the next clustering level? The distance from Pat to either Flo or Bob is 2.256, whereas the distance between Pat and Zeke is 2.250. Hence clusters P and Z are consolidated to create C3.
The next Complete step hinges on the distance between clusters C1 and C2, between C1 and C3, and between C2 and C3. The corresponding maximum pairwise distances are between Bob and Liz, between Bob and Zeke, and between Liz and Pat, which are all very similar. The distance from Bob and Liz is smallest, so clusters C1 and C2 are consolidated next, with a small net step to the next and final level of consolidation.
4. Under the Single linkage method, the third step (the third horizontal bar moving up from the bottom of the dendrogram) entails adding another point to S2. Which point is it?
 MSS: Pick Points
 Click on the fourth point from the left hand side of the Single dendrogram shown in D4.
In the message area you see:
        	 Pick:
        	 ROW 4 LIZ
This occurs because the distance from L to S2 is defined as the shortest distance from Liz to any element of S2; in this case, that is the distance to Herb (1.51). Liz is thus absorbed in the cluster, S3. Pat and Zeke are then absorbed into the expanded cluster in rapid succession.
5. The progression for Average clustering is less intuitive. In this case, the third clustering level after A2 was formed entailed pairing up Liz with some element not in A2. Which one?
 Click on the right most point at the bottom of the Average dendrogram shown in D3.
In the message area you see:
        	 Pick:
        	 ROW 6 ZEKE
 Click on End Select to terminate point picking.
This consolidation is next because the distance between Zeke and Liz (2.23) is less than that between Pat and Zeke (2.25), and less than the average distance between Liz and the elements of A1 (3.50, 2.50 and 1.51; average 2.51). Call the new cluster A3.
The penultimate Average clustering step is to add Pat -- the only remaining unselected row -- to A2, because the average distance from it to the elements of A2 (2.26, 2.26, and 2.75; average 2.42) is less than the average distance to the elements of A3 (3.66 and 2.25; average 2.96).


1
This discussion is cast in terms of distance for ease of discussion. In fact, however, the hierarchical clustering algorithm actually uses similarity to determine which agglomeration to do next. Similarity is inverse to distance where distance is well-defined, but, unlike distance, can be used where the triangle inequality may not apply, e.g., for fingerprint descriptors.
Copyright © 1999, Tripos Inc. All rights
reserved.


 Select rows Bob and Flo in cluster_types.
 Press Show RowSel.
 Press Cancel in the Locate prompting dialog.
 Select the third row, Herb, then press Show RowSel.


 MSS: Pick Points
 Click on the fourth point from the left hand side of the Single dendrogram shown in D4.
 Click on the right most point at the bottom of the Average dendrogram shown in D3.
 Click on End Select to terminate point picking.

