4.3.4 Examination and Use of CoMFA Results
Assuming a satisfactory q2, there are two main uses for a CoMFA:
- Designing new compounds, based on examination of displays of the CoMFA results;
- Predicting the target property values of the newly-designed compounds.
4.3.4.1 Identifying Dominant Descriptors
The first task is that of identifying the most important classes of descriptors. While there is no universally accepted measure of descriptor importance, MSS: QSAR >>> Report QSAR (QSAR ANALYSIS LIST PLS CONTRIBUTION) shows how the sum of standard deviation multiplied by the coefficient is partitioned among the individual CoMFA fields and any non-CoMFA columns.
Any QSAR has two terms per ordinary CoMFA column for every lattice intersection, expressing the relationship found between changes in the magnitude of either the steric or electrostatic field at that point and changes in the target property (refer to Figure 18). Because of this correspondence between a term and a spatial position, the QSAR (and other associated data) is naturally represented as a three-dimensional scatter plot, in which the color of the points indicates the magnitude of a term. Two such plots are needed to convey both the steric and electrostatic aspects of the CoMFA QSAR.
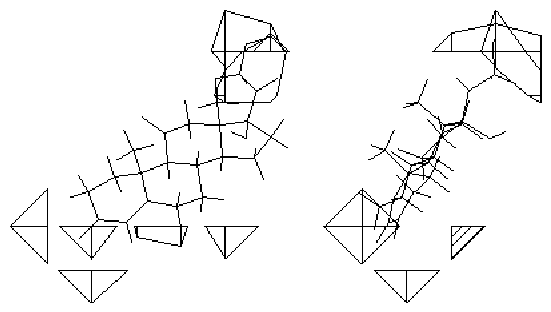
Figure 19 Orthogonal views of the contour map of steric QSAR from CoMFA of steroids binding to Corticosteroid-binding Globulin [Ref. 9].

A better sense of where in space the QSAR terms have high or low values can be obtained by contouring the electrostatic and steric terms. A familiar example of a contour map is a geographical relief map, in which lines on a page connect points that have the same height above sea level. Similarly, the three-dimensional iso-contour surfaces produced throughout SYBYL are composed of lines that connect points which, according to interpolation along all of the grid lines connecting actual observations, have the same value of the variable being contoured. When CoMFA QSAR-related expressions are iso-contoured, the resulting surfaces are usually closed polyhedra, surrounding regions of space in which the coefficients take on extremely high or low values. (Lack of closure occurs whenever the polyhedra intersect a non-existent value: usually occurring at the edge of the lattice, at a lattice point occupied by all molecules in the dataset, or at a lattice point whose variance was less than the value in the Column Filtering check box on the Partial Least Squares Analysis Dialog (TAILOR SET QSAR MINIMUM_SIGMA). Figure 19 shows an example of such a contour map.
Before a scatter graph or contour can be obtained from a CoMFA analysis, the PLS results must be turned into named fields, using MSS:QSAR >>> Manage CoMFA >>> Fields (QSAR COMFA FIELD RETRIEVE). MSS: QSAR >>> View QSAR >>> CoMFA (QSAR COMFA FIELD GRAPH) then produces the desired images.
- When retrieving the fields you should probably choose STDEV*COEFF, which most clearly shows where differences in fields are most highly associated with differences in target property. But other types of field can also be helpful. For example, SIGMA_FIELD can show where in space the molecules so far tested do not differ much.
- Before you can view the fields you must select either a contouring procedure or a coloring scheme. The intelligibility of the resulting display depends on this difficult decision. The first time we recommend the contribution option which interprets the contour values as percentiles. By default contour lines will enclosing only terms having extreme values (usually 80% of the signal).


Copyright © 1999, Tripos Inc. All rights
reserved.


